

National Fire Plan Success Story
Burned Areas: They Don’t All Look the Same
National Park Service Alaska Region, Alaska
National Fire Plan - Rehabilitation
2008
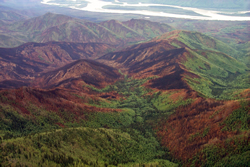
Fire mosaic resulting from varied burn severity of the Witch (B242) Fire of 1999 in Yukon-Charley Rivers National Preserve.
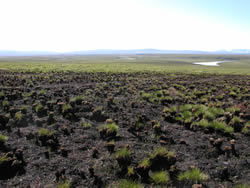
Moderate-high severity burn in tussock tundra on the Seward Peninsula with partial re-sprouting of cotton tussock grass. On the horizon, low severity burn reveals quick recovery of tussocks. (Milepost 85 fire; A526).
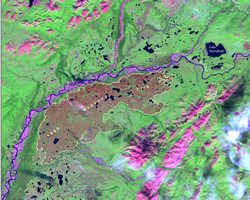
Landsat satellite imagery of the 88,000 acre Uvgoon2 (B333) Fire, which burned in Noatak National Preserve in 1999.
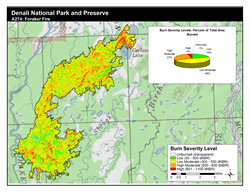
Burn severity map of the Foraker (A274) Fire, which burned 18,000 acres in Denali National Park and Preserve in 2000.
A common misconception of wildland fires is that they affect all burned areas the same. In reality, the effects of fires across the landscape are highly discontinuous and varied. In any given fire, some areas of the landscape are radically changed due to intense scorching or sustained burning, while other areas are completely untouched. This varying burn severity results in a heterogeneous pattern or fire mosaic on the landscape. Burn severity is a measure of the ecological impacts of the fire, in terms of plant survivorship or mortality, depth of the burn in organic layers, or amount of biomass consumed. Information about burn severity helps fire and resource managers understand the effects of wildland fires on the fuel, vegetation, and wildlife of Alaska’s national parks.
To understand burn severity and wildland fire’s effects on Alaska’s national parks better, the NPS Fire Management Program, in conjunction with the U.S. Geological Survey (USGS) EROS Data Center in Sioux Falls, South Dakota, have used remote sensing to map burn severity for all large NPS fires in Alaska since 1999. Burn severity maps and GIS datasets are created by analyzing the differences in Landsat satellite imagery collected before and after the fire. Fire management staff uses burn severity maps to refine and improve final fire perimeters and to identify unburned islands within a burned area. In addition, these burn severity data products provide a means to update fuels and vegetation GIS datasets to reflect the changes on the landscape brought about by each passing fire season.
NPS fire management staff has installed nearly 300 plots within burned areas occurring in several NPS units in Alaska to test the accuracy of the satellite-derived burn severity maps. The linear regression between these plots and the satellite-derived burn severity maps showed a positive correlation between ground and remote sensing measures of burn severity. These results have been published in both Alaska Park Science (PDF) and the International Journal of Wildland Fire. Additional work continues on interpretation of burn severity maps and the application of burn severity data products in land cover and fuels mapping. Through burn severity mapping, NPS fire management staff are increasing their understanding of the effects of past fires and enhancing their ability to predict the behavior and consequences of future fires in Alaska’s national parks.
Contact: Brian Sorbel, Regional Fire GIS Specialist or Jennifer Allen, Regional Fire Ecologist, (907) 644-3413 or (907) 455-0652.